

How much should I be spending on acquiring customers?
How much should I be spending on acquiring customers?
Benchmarking for Early Stage Founders Part 2

After a brief hiatus, let’s tackle a burning question that is top of mind for founders once they reach the “problem-solution-fit” stage (Link). The question of “How much should I be spending on acquiring customers?”
Problem-Solution-Fit
I’d describe this stage as reducing churn, early signs of an ICP, customers using the product more and more progressively, and being able to provide a high NPS for the product.
Up to this stage, it’s mostly a founder-led sales process, but once you see these signs, it’s time to start building your scaling engine.
You now have a product that people like and your job is to put it in front of as many such customers as possible.
This is also the time to start hiring your Sales and Marketing teams.
One of the disconnects we have noticed at this phase is the question we are trying to tackle today.
That of, “Am I spending enough, am I spending less, Am I spending a lot?” and how have others dealt with this in the past.
The answer to this problem is 2 fold.
You need to measure 2 metrics, your CAC Payback as well as your LTV/CAC to make sense of how your scaling engine is performing.
CAC Payback
Your CAC Payback is essentially how long it takes you to make your sales and marketing dollars back.
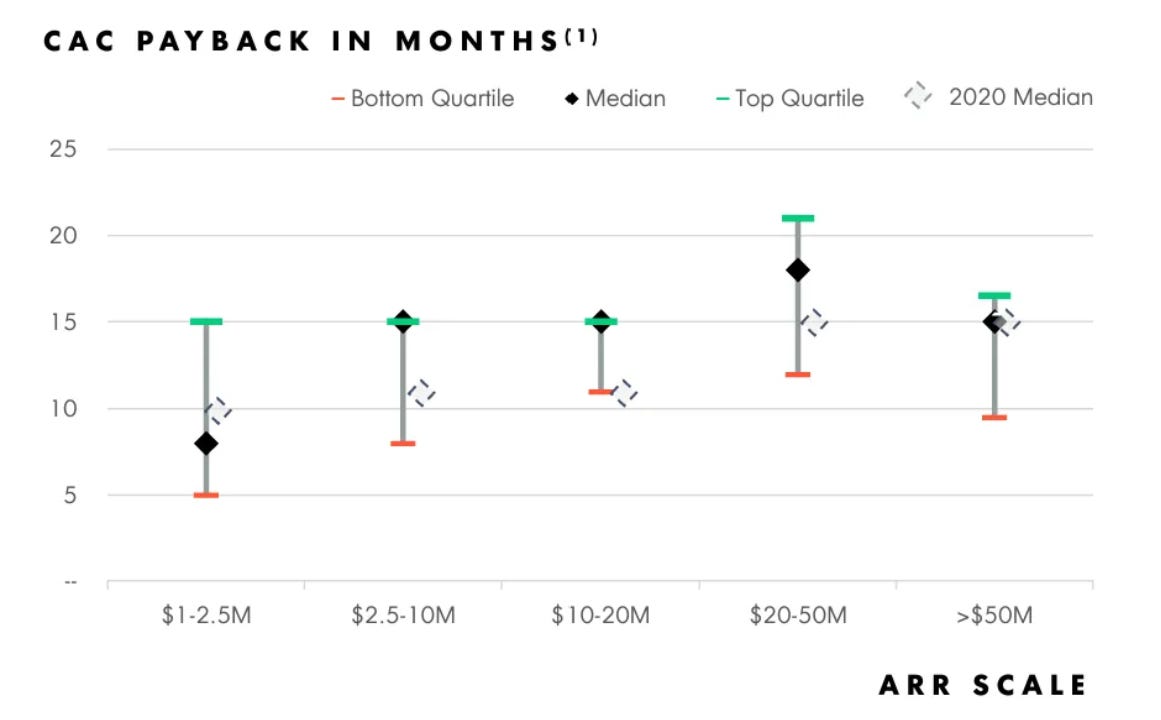
The infographic below by Openview is quite interesting. Your CAC Payback (we will get into the definition later in the piece), is not a fixed number. It keeps shifting depending on your scale.
This is an oversimplification but the reason the $1-$2.5M CAC Payback is considerably lower than the rest of the periods was that this is a pre-scale metric. Once the “PSF!” is achieved in some manner, it’s time to go acquire customers.
This however should not be taken in isolation. It’s important to tie this up with the next metric.
LTV/CAC
This will give you how valuable the customer is.
Lifetime Value of the Customer(LTV) is important because, if you have a high LTV, you have the runway to go spend more on acquiring customers (CAC). And on the other side of the coin is making sure that you aren’t spending more than what you will make from the customer.
LTV is a tough figure to capture in the early stages. Especially in cases where you’ve gone through a major pivot recently, or your product is less than a year old, or if you’ve signed multi-year contracts.
But I would say that in these stages, it is key to measure your dropoff rates as granularly as possible. Examples of this would be, such as dropoff after onboarding, dropoff at the monthly billing cycles, and dropoff because of product issues. As this will give you signs of what your LTV would look like.
The reason both these metrics should be used together is that they form 2 critical parts of your scaling engine.
CAC Payback: Represents the cash efficiency of spend to acquire these customers
LTV / CAC: Represents the margin efficiency of an investment to acquire customers (ROI)
High cash efficiency is where you invest your S&M dollars, make back what you first invested, and reinvest them quickly into acquiring new customers.
On the other hand, high margin efficiency means that each dollar of investment will pay back multiples in the future.
A well-calibrated machine has the ability to create a flywheel of exponential growth. The goal is to align the dollars you spent in the past to generate the sales (ARR) you are seeing today. These should be tracked as granularly as possible, by channels, ICP, end-user industry, etc. Whenever relevant.
Let’s move on to how you should be calculating this.
Here, I’ll mostly reference Mostly Metrics, since he had written about this with all the nuance required.
CAC
Previous period S&M Expenses/Current Period New Customers
LTV
Average Annual Revenue per Account * Gross Margin / % Average Account Churn Rate
CAC Payback
(Previous Period’s S&M expenses* 12 (Depending on time period used)) / (Current Period’s New ARR * GM)
Definitions
The idea for different time periods is given below but simply it varies according to your sales cycle (you would use the current period’s addition of new customers but the time period of S&M expenses would depend on your sales cycles)
Previous Period — Examples of lagging by segment
Enterprise sales cycle of 180 days = 2 quarter S&M lag
Mid-Market sales cycle of 90 days = 1 quarter S&M lag
SMB sales cycle of 30 days = 0 quarter S&M lag
New ARR — New recurring revenue added in the particular period
S&M Expenses — All sales and marketing expenses including Sale team payroll, Marketing payroll, Customer success payroll, Sales Software, Rev ops and Sales enablement, and trial costs. In some cases, things like non-cash stock-based compensation aren’t added. However, they should be for accuracy.
New Customers — New customers added in the particular period.
Average ARPA — Average of your annual revenues across customers
Gross Margin — Variable expenses here include hosting costs, customer costs, etc.
Average Account Churn Rate — Inverse of your average account retention rate, measured on an account basis
This is a good time to look at the below figure and see how some public companies have executed on these metrics.
Note: I have used S&M expenses here (Since LTV/CAC is not disclosed generally) but will go into this as well as LTV/CAC below.

Source: Clouded Judgement
This infographic is interesting but a nuance they are unable to capture is that generally, you’d see lower payback periods for SMB software compared to Enterprise software.
There’s structural churn embedded in an SMB business, with a higher % of companies going out of business, and companies doing well needing more calibrated software to suit their needs. Meanwhile, in the case of enterprise companies, the cost of setting up, from procurement practices, to customization, etc. means that the opportunity cost to switch software is much higher.
Examples
Now, we’ve gone through the what to track and how to track, let’s quickly touch on some qualitative examples of successes and the path they picked.
Veeva (Enterprise — Low Payback and low S&M expenses)
Lifesciences cloud
Efficiency had been ingrained in Veeva’s history. Founded in 2007, they raised $3M in an angel round and a $4M seed, which interestingly wasn’t even used. They used Angel money to build the platform and the rest of the growth was funded by their customers
IPO’ed in 2013 and today, at a scale of over ~1000 customers and a $30B Market Cap, it has a CAC payback of 8 months while spending only 17% on S&M expenses. Selling to enterprise meant that their first Customer came with a $3M ACV contract
💡 In Veeva’s case, they were selling solely to life sciences companies. Since it was a limited set of companies, their sales efficiency was quite historic. Even today, their biggest 100 customers make up the bulk of their revenues.
Snowflake (Enterprise — Low Payback and High S&M expenses)
Data Warehouse
Snowflake raised $2.1B in overall funding and has spent heavily on its sales and marketing engine with S&M expenses of 61% (of total revenues) in FY21 down from 81% in FY20
Even with this scale of spending, their CAC Payback comes to 14 Months
💡 With their metrics, the annual growth rate of 91% with a 170% NRR, it makes sense for them to spend as much as they can to acquire customers
Zoominfo (SMB — Low Payback and Low S&M expenses)
Sales Intelligence
Zoominfo had efficiency ingrained in its DNA with the way it started. The founders, Henry Schuck and Kirk Brown started with 50k credit card expenses and took no funding for 7 years till they hit $25M ARR
At the time of their MVP, they had information for 10,000 people on the platform. Today they are at 130M with revenues higher than $600M
💡 They have carried their sales efficiency from the beginning and to date, their CAC Payback is ~6-10 months. They also do this along with very short sales cycles which allows them to get started immediately — Sometimes it’s within a day
Hubspot (SMB — High Payback and high S&M expenses)
Marketing Automation
Going through these learnings helped them increase their LTV to 52k from 25k while keeping the CAC around the same $10-11k. This enabled them switch on the scale engine
I wanted to highlight an interesting point in time for Hubspot. The below excerpt is taken from an article by the CEO of Hubspot where he went into the scaling issues they faced in their journey (would highly recommend reading it!). The Mary Decision — Link
💡 Today, Hubspot is growing faster at a $1.7B ARR than it was last year at a $1B ARR. 41% against 32%. Their high S&M allows them to get 50% of all new revenues from new customers, all while setting up a strong cross-sell engine with 50% of New Upmarket Customers using 2+ Products.
Let’s move on to some benchmarks
On CAC Payback
In the early stages, a 5-15 month payback period seems like a good band to be in, depending on your end-user category and the industry you operate in.
Below are data points by a few VCs that point towards the same figures.
Bessemer puts CAC payback in the $1-$10M stages at 15 Months. This increases to 20-25 months in the $10-$100M stages and curiously 30 Months at a >$100M scale.
Openview, on the other hand, breaks this down even further. Top Quartile performance for companies in the range of $1-$2.5M is 5 Months, going to 8 Months for companies in the $1.5M-$10M scale. This is ~15-20 Months for companies between revenues of $10M→$50M.
Craft Ventures, during the May ‘22 market crash, put great CAC payback at 6-12 months, good at 12-18 months, and anything over 24 in the Danger Zone.
On LTV/CAC
As for LTV/CAC, good would be above 4x — 1x CAC, 1x-2x in your G&A and R&D, and the rest as free cash flow to reinvest in your scaling engine.
Another thing to keep in mind is tracking cohorts — Growing customer LTV → Good sign. Reducing customer LTV → Not a good sign.
Capchase, in an analysis of 439 private SaaS companies with $1 - 15m Annual Recurring Revenue put top quartile LTV/CAC in companies in the range of $1M-$3M at 4x, for companies between $3M-$5M at 3.5x, $5M-$10M at 4.5x and for companies in the $10M-$15M range at 6x.
I’d say anywhere between 4x to 10x is great performance with additional context coming from your CAC Payback periods.
Also, beware of very high LTV/CAC. A high LTV/CAC (double digits) is great for maturing companies, however, at earlier stages, it always makes sense to spend a part of that future LTV into ramping up growth.
Conclusion
Your payback period and LTV indicate the health of your GTM engine — they need to be measured together.
However, a nuance I’d like to add here goes back to the $1M-$5-10M journeys. A low CAC Payback allows you to fund your growth through customer revenues whereas a high CAC Payback will push you toward growth through VC dollars.
Neither situations are right nor wrong, but you have to find your path or take the path available to you. This is the point I wanted to highlight with the examples of Veeva, Zoominfo, Snowflake, and Hubspot.
In my experience, if you don’t have this thought process in place, there’s a chance you can get swayed by people giving very generic advice like “keep your CAC low”, or “it’s time to blitzscale”. These statements in themselves, while having some value, are meaningless. It also does not make any sense to track metrics like CAC any earlier than this.
You can also reduce CAC Payback by upselling better, increasing your sales funnel conversion, and/or adding “PLG” to your software (we’ll get to this at a later point).
Finally, I’d like to understand if this was helpful in any way in thinking about how to set up your scaling engine.
Feel free to reach out to me or my colleagues if you are building B2B Tech for Global Markets.