
“How quickly should I be growing?”
Benchmarking for Early Stage Founders

This question asked recently by a founder brought me into writing my own “VC advice during the downturn” piece.
There’s no one answer to this, and anything anyone says must be caveated with what’s the basis of that point of view.
However, this isn’t to say that this question is not meaningful at all. It is. And through some frameworks, I will try to show that.
To me, this question comes down to the trajectory you sign up for, if you take on venture capital. If you want to take it to venture-level success (IPO), then we can backtrack to see what we should benchmark against at any stage of the journey.
The truth is, when you take venture money for your business, you get into the game. The game of velocity. And to be in the game, you have to play by some of the game’s rules.
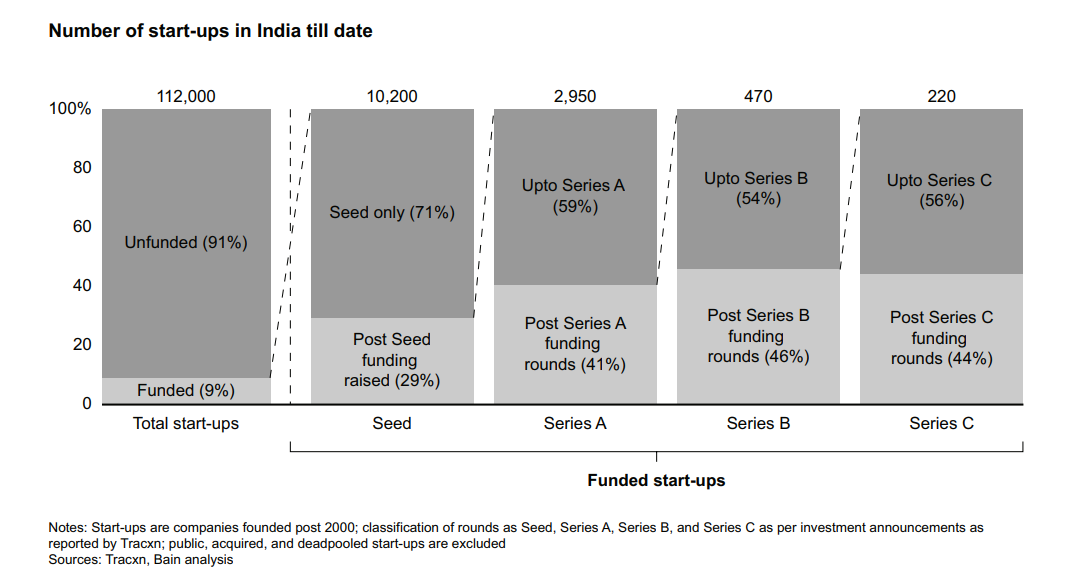
This infographic by Bain shows the number of startups that go on to raise a follow on round of funding. We can see that even after each level of market feedback, the ratio of success while moving up stages doesn’t grow meaningfully. At every stage, less than half of your cohort will be able to raise their next round of capital.
This means that, at every stage, your business has to stack up favorably against others in terms of performance.
There are approximately 150-200 SaaS startups doing between $1M-$10M ARR in India. This piece should broadly apply to them. However, the intention of writing this piece is just to get the perspective out and not be prescriptive. This can be used as a general framework to keep in mind, with a few caveats at the end.
I will cover ARR growth here and I’ll be following this up with posts in the next month to go into more detail on other metrics and segments. So, let’s get to this.
Why Growth?
We’ll first qualify the question of why ARR Growth is the most important metric, to begin with.
For this, we go to what success looks like for a venture-backed startup — growing to IPO scale. Of course, there are multiple roads to success, but let’s stick with this one for the sake of simplicity.
This is what a US SaaS company at IPO looked like over the last 5 years. (Source: Clouded Judgement)
$200M ARR (minimum $100M)
90% of revenue derived from subscriptions
50%+ YoY ARR growth
$18M of net new ARR in the quarter you go public
72% gross margins
121% net dollar retention
25 months gross margin adjusted CAC payback
(31%) LTM operating margin
You’d now come back and tell me that wait there are so many metrics here, so which one is it? Which one should I prioritize today?
Well, one data point comes from Guggenheim Securities. This puts the relative importance of Revenue Growth towards Valuations at 2x when compared to FCF margin growth.
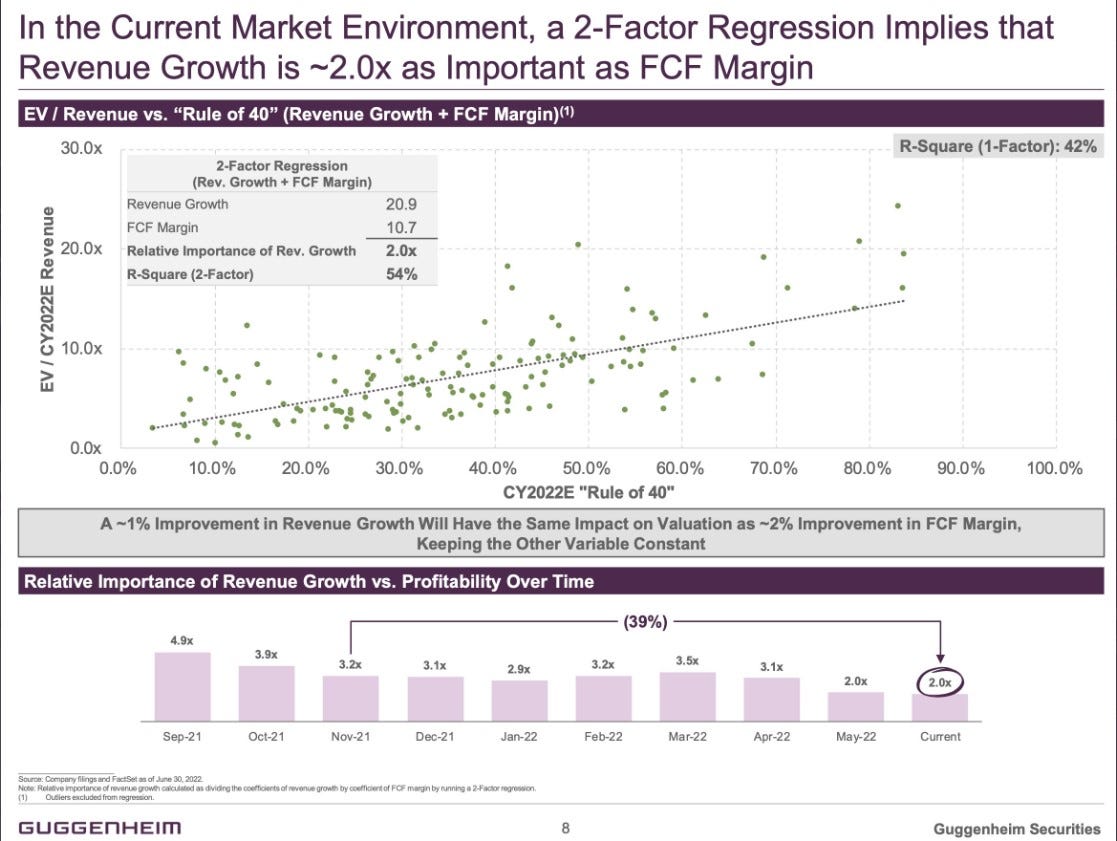
This should establish the fact that ARR Growth is one of the critical indicators of growth in valuations.
This takes us nicely to the next question. Let’s say you have started growing.
Now, what’s a growth metric to target?
Let’s go back to what success looks like. IPO scale.
The minimum revenue number you need to get to is $100M. So how quickly do you need to get to it?
One of the ways of looking at this is the Mendoza line (a coinage from baseball, more info here).
This will give us a baseline for what is generally considered venture backable. This benchmark would largely be relevant at every point, although the linearity and consistency of the ARR growth are less important.
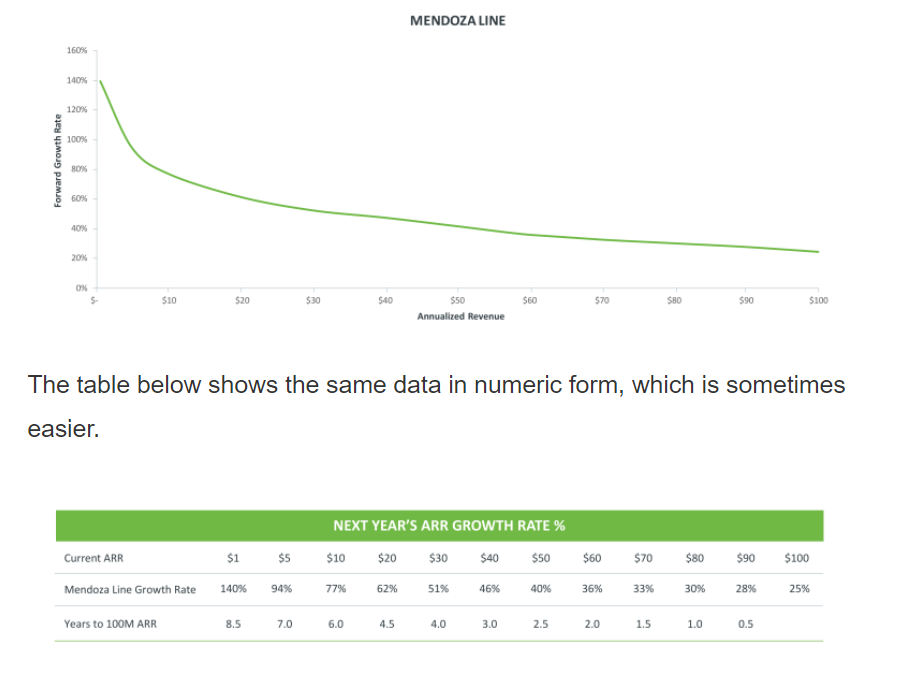
So, we can set the baseline of ARR growth in a less than $10M stage to grow 125%+ to be venture-backable. This would take a company to the $100M mark in 9 years. And while this might seem like exceptional performance, there have been companies like Workday, who at the time of their IPO was doing ~$250m in ARR while still growing ~90%.
Having gone through the lower end of the venture backable growth spectrum, let’s see how this looks for the leaders.
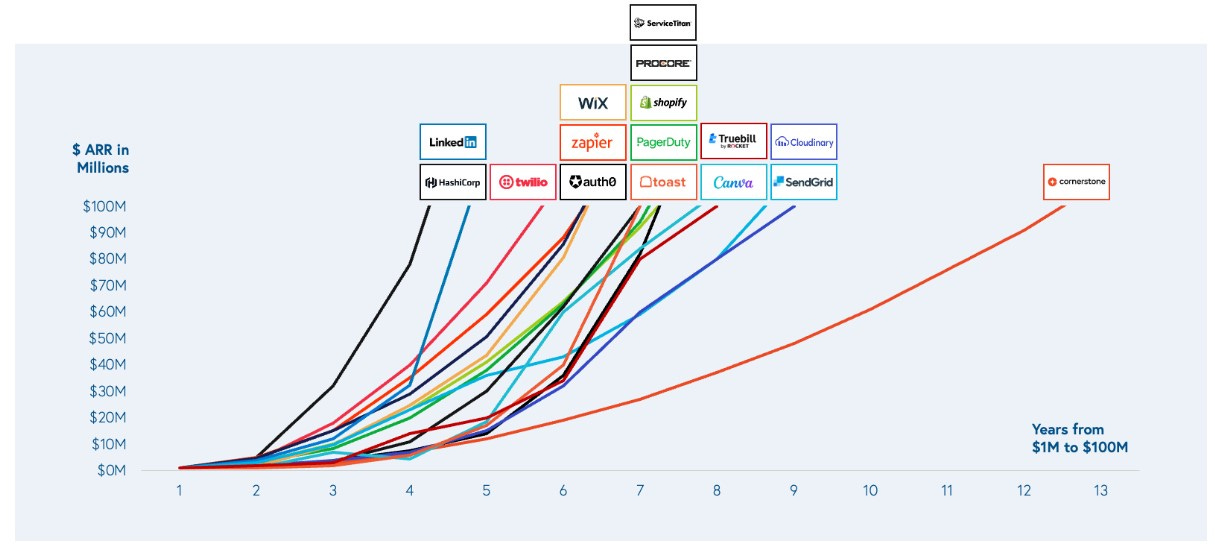
Another common heuristic is the Triple, Triple, Double, Double, Double. Tripling your revenues the first 2 years, and then doubling every year for 3 years.
If you start at $1.5M ARR, this will take you to $4.5M in the first year, $13.5M in year 2, $27M in year 3, $54M in year 4, and $108M in year 5. While this sounds very mathematical, the infographic below shows a whole host of top-of-the-line SaaS companies that have achieved this.
We have covered the top and the average ARR growth rates that you as a founder should benchmark against.
Another point of view on the ARR Growth rate would be to look at this every month. If you are growing 8% MoM, you are hitting a 150% YoY growth rate. at ~12% MoM growth, you are at 3x of your last year’s ARR.

All this is largely backed up by some of the metrics from VC funds like Craft Ventures and Bessemer Venture Partners for the US and India.
According to Bessemer, you are amongst the best of the crop in India if you are growing at >150%, while 100%-150% ARR Growth puts you in the range right below that.
Comparing this to what Craft Ventures put out for US-based SaaS companies, 300% ARR Growth is what they look at to be top of the line while 250% would be in the range right below that.
Note: Top-of-the-line Indian ARR growth rates are lower than their US peers. Interestingly, this doesn’t necessarily have much relevance to the quality, as I will touch on when we look at other metrics in the coming weeks.
So as an answer to how fast you should be growing, we’d say 8-10% MoM will keep you in the “default investable” category.
If you are below 6% MoM growth or below ~100% YoY growth, it’s time to go back to the drawing board to see where things can be improved.
One major caveat here is that these numbers and figures that we have looked at today aren’t going to be meaningful to everyone — These are applicable very strongly once you have a level of repeatability in your business model when you have a product in place and have figured out an early sales motion. However, pre-PMF (product-market-fit, described here by Marc Andreessen), you can use these frameworks to understand if your current traction is good enough or not.
With this piece, I hope you take away some of the heuristics to keep in mind when it comes to ARR growth. Especially when you are transitioning from your founder-led sales to adding resources to your sales and marketing engine.
Over the next few weeks, I am going to follow this up with more metrics that you should track and know where you stand. I would also love to hear from you if you have started looking into benchmarking where you stand today or if there’s something adjacent to this you’d like for me to cover.
And if you are building B2B SaaS or Enterprise Tech from India for Global Markets, I’d love to hear from you!