


Decoding the Metrics for SaaS IPO Success
Part 2 of 3


Following last week’s blog, the question standing now is whether Klaviyo’s IPO was the catalyst needed to open up the SaaS IPO markets. With many indicators showing that numerous companies will follow Klaviyo, we now delve into the common characteristics of previous SaaS companies that went public, and explore what it takes for a successful SaaS IPO.
This examination includes both metrics at the time of the IPO and current data points of publicly traded companies. Our goal is to provide a comprehensive benchmark for early-stage companies aiming for public market success.
Top line Metrics Metrics
Exploring key top line metrics is crucial for SaaS companies preparing for an IPO, especially since these are some of the components most prominently visible to potential buyers, in particular, growth rates and revenue.
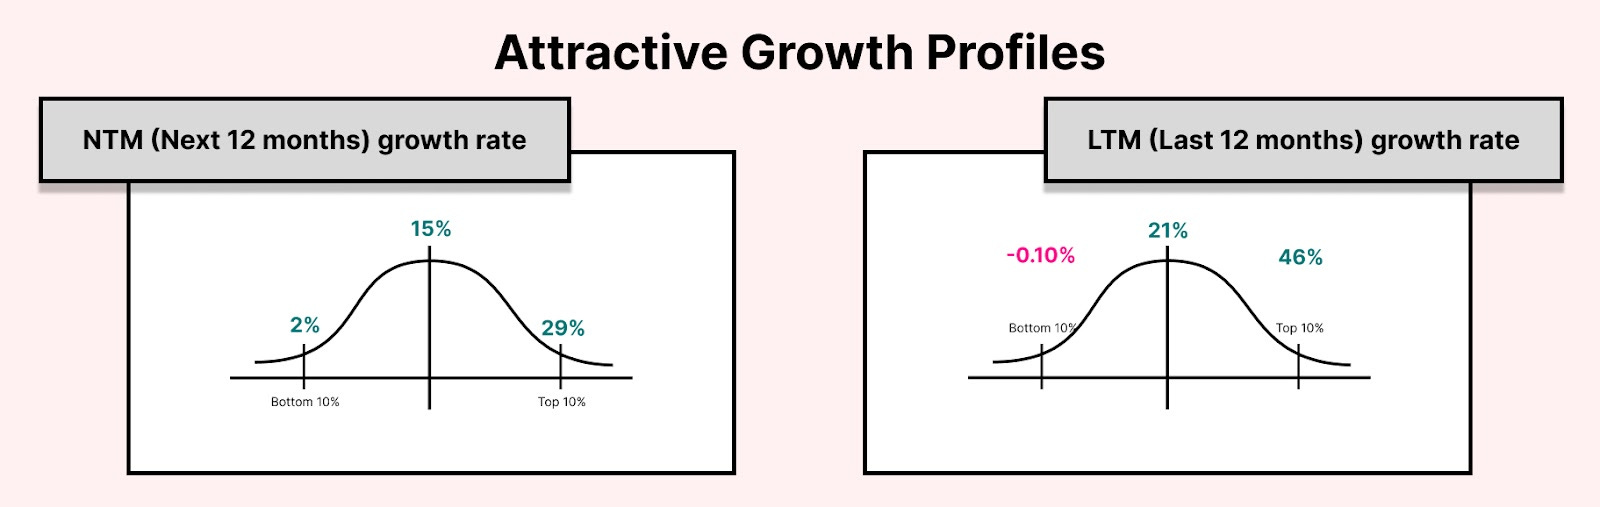
NTM Growth Rate
NTM stands for Next Twelve Months. The NTM growth rate is an estimation of a company's expected growth for the upcoming year. Hence, this is the forward looking estimation.
It is relevant to SaaS companies because it provides insight into their expected revenue growth over the next twelve months, which is a key factor in determining their valuation.
A Next Twelve Months growth rate over 20% likely increases confidence for companies going public. Median growth rate for public SaaS companies was 15%, while the top decile came in at 29%.
LTM Growth Rate
LTM stands for Last Twelve Months. It is a company's actual growth over the past year.
LTM growth rate is an important metric as well, because it measures the growth in actual ARR over the past twelve months, as compared to NTM which isn’t explicitly known. LTM growth rate is typically higher than NTM rate.
Companies should aim for at least 30%+ LTM Growth rates at the time of IPO. Median LTM growth rate for public SaaS companies is 21%, and the top decile show an astonishing 46%.1
Revenue at the time of IPO
Total revenue may be the biggest gating factor to going public. Companies simply need a certain scale for public markets to be receptive.
Most SaaS businesses going public fell into the $150M - $250M range, and very few had a revenue less than $100M. Especially with the SaaS markets maturing, expectations regarding a higher revenue before IPO have become the norm. On an average, founders should aim for about $200M of LTM Revenues before an IPO.2
Operating Metrics
Operating Metrics are arguably the most important component on this list, since they depict the financial and operational standing of a company. From a perspective of fundamental analysis, these are critical to evaluate the standing of a firm looking to go public.
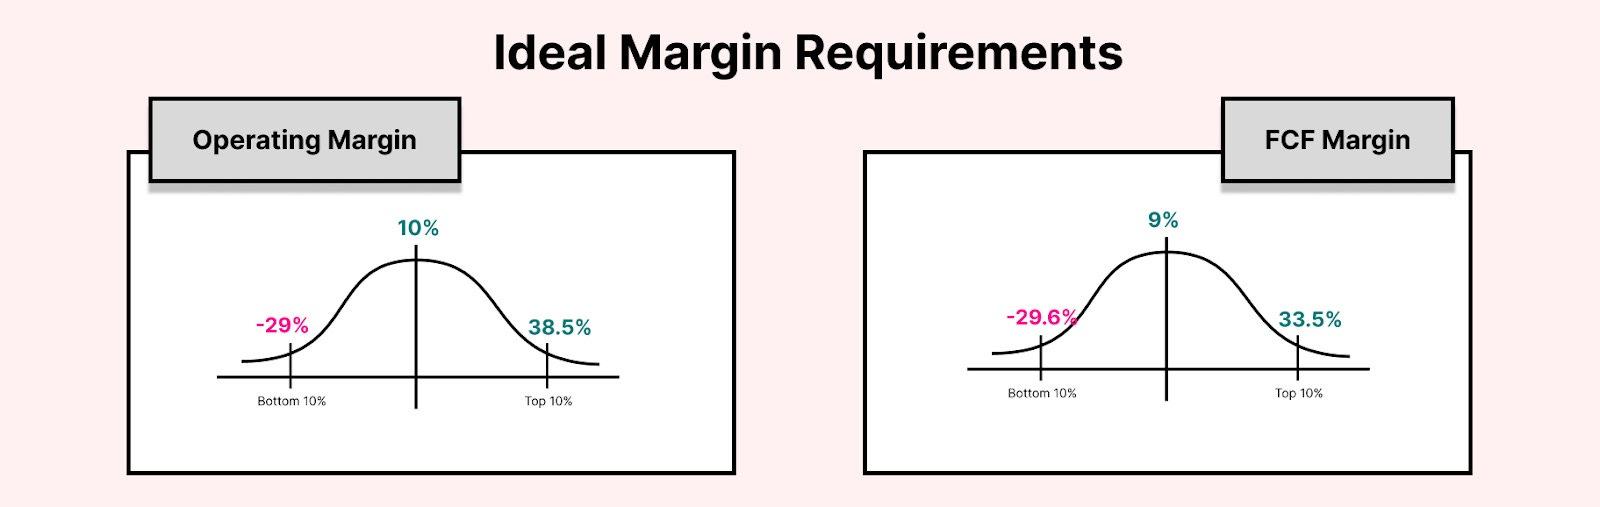
Operating Margin
The operating margin measures how much profit a company makes on a dollar of sales after paying for variable costs of production.
Despite most SaaS businesses not being profitable when they go public, they bring the promise of profitability through recurring revenue.
With this in mind, the median operating margin for all public software firms is 10%, however the top decile come in at a much higher value of 38.5%.
FCF (Free Cash Flow) Margin
FCF Margin is the amount of cash available to a company after paying all expenses and making long-term capital investments.
It measures how much of a company’s revenue is converted to free cash flow, and hence is an indicator of the efficiency of the company’s financial management.
A great cash flow for SaaS companies lie somewhere between 20 to 25%, although the median for public companies lies at 9%.
Net Retention

Net Dollar Retention is calculated by dividing the sum of starting ARR plus Expansion Revenue minus Churned Revenue and Downgrades by the starting ARR.
Although the threshold varies slightly depending on the SaaS sub-sector, a net retention rate of over 100% is generally considered healthy. A high Net Dollar Retention rate in a SaaS company signifies strong customer loyalty, successful upselling, stable revenue, reduced reliance on new customer acquisition, potential for long-term growth,
The median net dollar retention of the companies above is 111% so that should be your target with the top decile at 128%.
Rule of 40

The Rule of 40 is a key metric used to to help assess a company's balance between growth and profitability. The Rule of 40 states that a company's combined growth rate and profit margin should be equal to or greater than 40%.
This rule is used to measure the trade-off between profitability and growth and hence is one of the more comprehensive measures on this list.
While the median value for Rule of 40 lies at 32.5% for all public SaaS companies, the top decile come in at an impressive 57.9%, which is testament to the importance of this base requirement for companies looking to go for an IPO.3
CAC Payback

CAC payback period, or simply payback period, is a metric that tells you how long it takes for a company to earn back the money invested in acquiring customers, which helps evaluate the sustainability of a company’s growth.
To calculate this, divide the customer acquisition cost by the average revenue per account multiplied by gross margin percent.
For companies that are still private, anything around 12 months is best in class, while under 20 months is considered fairly good, indicating that the company’s burn rate isn’t too high. Keep in mind that a too short payback period might indicate underinvestment in growth, potentially missing market opportunities. Conversely, a too long payback period suggests inefficient spending and a risk to cash flow.4
Bottom line metrics

S&M % of Revenue
Sales and marketing costs are one of the expenses that tend to balloon up the quickest. While S&M expenses do increase with growth, it should be ensured that the payback period stays fairly low.
While the median for public SaaS companies is at 35% of revenue, the top decile performers like Digital Ocean and Veeva spend below 14% in S&M.
R&D % of Revenue
Early on, when companies are young, the best ones have expenses dominated by by R&D indicating that it is heavily investing into building a great product. As the ARR increases, the R&D expenses start to reduce in favor of the S&M expenses, and a range of 25-30% is considered good, although some of the most successful companies Salesforce, Toast, etc. spend as little as 10%.
G&A % of Revenue
While the General and Administrative costs being lower is a good indicator with the top decile companies coming in at under 10%, the main point of importance is that it should be relatively constant as a percentage of revenue.
What Valuation Multiples can you expect?
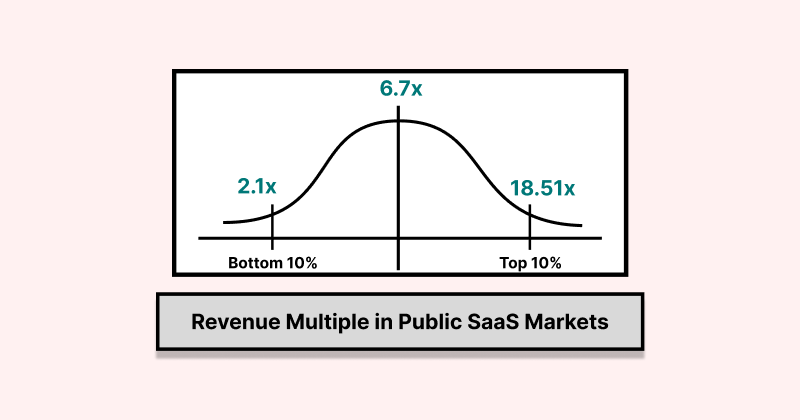
Valuation Multiples are ratios that reflect the implied value of companies in relation to a specific operating metric, in this case, it measures a company's valuation relative to its revenue.
Valuation Multiples, especially those for public companies, can vary widely based on market sentiment and hence often fluctuate with the state of the economy.
That said, the median revenue multiple for public SaaS companies sits at about 7x; The value for the top decile companies is nearly 3 times at 18.5x. This value increased from about 14.8x from about a year ago.
If the markets continue to grow from the bottom that was a year ago, there should be an increase in these multiples, a positive news for the upcoming IPOs.5
Part 3
Having covered some of the most prominent metrics that companies should aim for before going public, next is the question of how founders can build their start-ups towards this goal from day 0. To take a look at the early steps in the life of a SaaS company hoping to go public, stay tuned for the final part of this series!
Interesting read. Thanks for sharing!